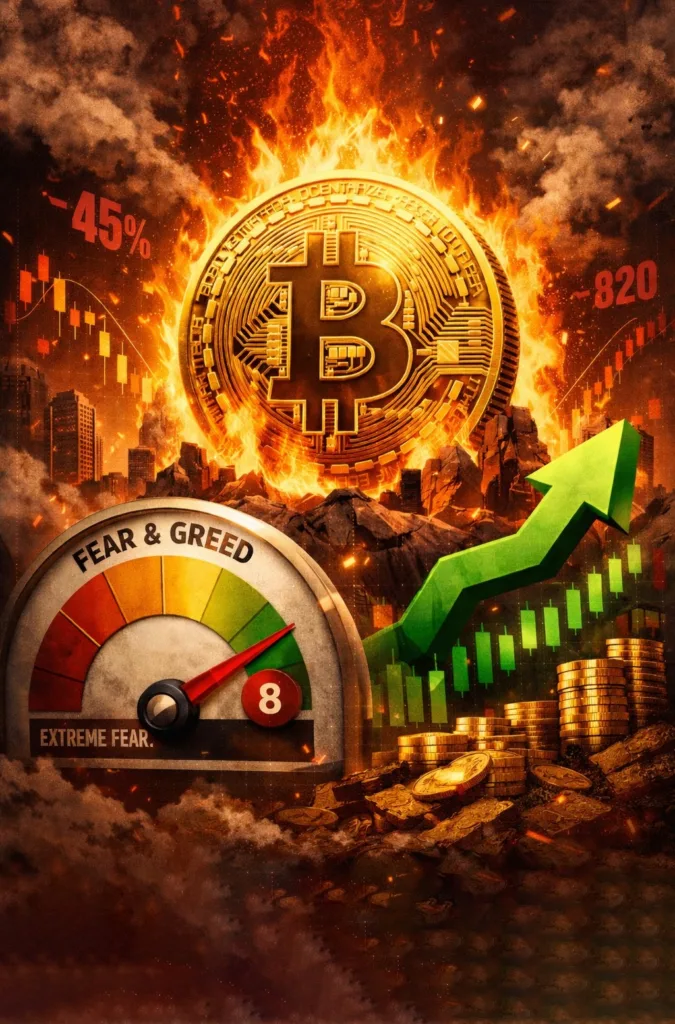
In the crypto market, a fear index reading below 10, when investor sentiment hits rock bottom, has historically marked the start of great wealth. BITPRESS analyzed data from past major crashes, and the numbers show that the very moment the crowd fled the market in fear was the best entry point, delivering record returns.
The Fear & Greed Index combines market volatility, trading volume, social media mentions and more into a single number from 0 to 100. A reading below 10 in particular is read as the capitulation stage, when investors ignore an asset's value and dump their holdings in a panic. Below is data on the main periods when the fear index fell below 10, and the meaningful changes that followed.
Historically, after the index fell below 10, rather than a ‘one-day bounce,’ a signal of a meaningful trend reversal— here are the four main cases where it became one.
1. The end of the 2018–2019 crypto winter (December 2018 to February 2019)
- Period: Mid-December 2018 (index low of 9)
- Situation: Bitcoin broke through its $6,000 support and crashed to the low $3,000s, filling the market with despair. Readings below 10 appeared on and off for about two months.
- Subsequent rise: After confirming a bottom around $3,200, by June 2019 it rose about 340%, touching $14,000.
- Meaning: It was a strong bottom signal that put an end to a long bear market.
2. The COVID-19 pandemic Black Monday (March 2020)
- Period: Mid-March 2020 (index low of 8)
- Situation: Global asset markets panicked over fears of shutdowns. Bitcoin plunged about 40% in a single day, falling to around $3,800.
- Subsequent rise: From this point, alongside a flood of liquidity, a historic bull run began. By April 2021 it had climbed to $64,000, a gain of more than about 1,500%from the low.
- Meaning: A textbook ‘V-shaped rebound,’ it proved that a reading below 10 was a once-in-a-lifetime opportunity.
3. The Luna-Terra crisis and the June crash (May to June 2022)
- Period: June 2022 (index low of 6)
- Situation: The fallout from the Luna crisis combined with fears of rate hikes pushed Bitcoin below $20,000. A reading of 6 is one of the lowest ever recorded.
- Subsequent rise: There was no immediate surge, but a long, grinding bottom formed between $17,000 and $20,000. Bitcoin then began a real rebound in early 2023 and, by its 2024 peak, rose about 330%from the low.
- Meaning: It signaled that the steep decline had stopped and the market had entered an ‘accumulation zone.’
4. The FTX exchange bankruptcy (November 2022)
- Period: Late November 2022 (index low of 10)
- Situation: When FTX, the world's third-largest exchange, went bankrupt, fear peaked that the crypto market itself could disappear. Bitcoin fell to around $15,500.
- Subsequent rise: This point is still on record as Bitcoin's ‘true bottom.’ It later broke through $73,000 in March 2024, rising about 370%from the low.
- Meaning: It shows that a reading below 10 amid the very worst news turned out to be the best entry point.
Summary and insights
- Frequency: Over the past seven years, the index fell below 10 in about five or six stretches (including brief drops).
- Meaningful signal: The four cases above were not simple bounces but the bottoms of market cycles— decisive moments that formed them.
- Returns: Expected returns within one year of a confirmed reading below 10 ranged from at least **300% to as much as 1,500%**.
Conclusion: An index below 10 means the crowd has lost rational judgment and is dumping on ‘survival instinct.’ The data show that in this zone there may be more short-term downside, but over the medium to long term it has always acted as a ‘strong buy signal.’