
Over the past six months, the crypto market's decline was not just a feeling; it showed up in the numbers. After peaking above $126,000 in October 2025, Bitcoin fell into the $81,000 range at its November lows, a correction in the mid-to-high 30% range from the high. During this stretch, the saying spread that “retail cut their losses while institutions accumulated.” The short answer: it is half true and half exaggerated.
- What is the evidence that ‘institutions bought’ during the past six months of decline?
The main channel for institutional money is U.S. spot Bitcoin ETFs. Their daily flows show that “institutions kept buying” is wrong, but “there were days when institutions bought heavily” is right. For example, on Jan. 6, 2026 (per U.S. reports), spot Bitcoin ETFs reportedly took in about $697.2 million in net inflows in a single day, with BlackRock's IBIT recording about $372.5 million of that. Yet just a few days later, there was also a day with about $486 million in net outflows.
It all comes down to one line: institutions are not “buyers every day” but “players who come in big when they come in, and head out together when they leave.”
- How do the numbers show that ‘retail sold’?
Data that officially separates individuals from institutions on exchanges with 100% accuracy is limited. So the market relies on indirect indicators. The most widely used reading is that “small hands dump in fear zones, and big hands catch in the same zones.” An analysis citing Glassnode data around the $80,000 range in late November 2025 noted signs that the cohort holding 1,000–10,000 BTC (large whales) kept buying (accumulating) for several weeks. In other words, during the decline, individuals were seen ‘dumping,’ and at the same time, big wallets were caught ‘catching.’
The key takeaway is this: the claim that “most retail investors sold” may itself be an exaggeration, but the tendency for small holders to lean toward panic selling and large holders to lean toward accumulation in fear zones is observed again and again in the data.
- Don't prices only rise when retail investors buy? Can they rise without retail?
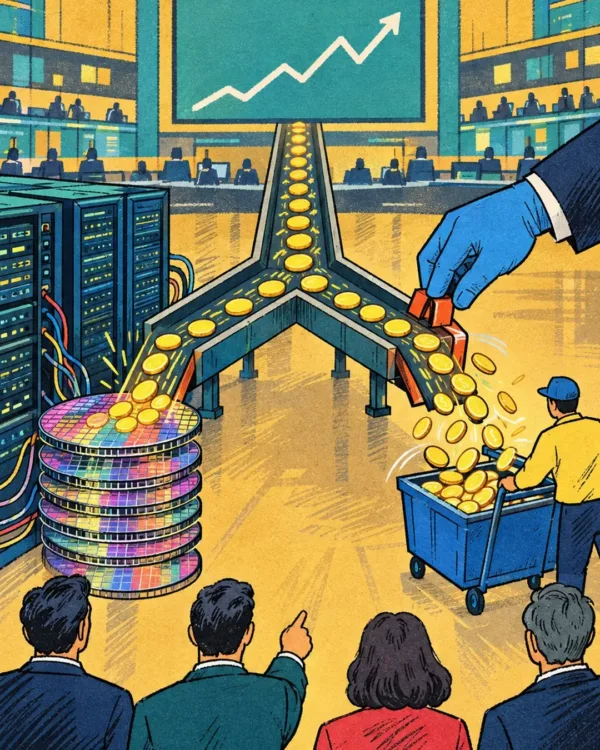
The short answer: yes, prices can rise without retail investors. Prices move on "net buying in dollars" and "how fast supply gets absorbed," not on "headcount." Institutions come in with large sums at once, and through channels like ETFs that absorb spot supply, they can quickly soak up selling in the market. Even when ETF flows swing sharply between inflows and outflows over a few days, as they did in early 2026, a stretch where "inflows keep stacking up" can lift prices even with weak retail participation.
That said, a market with no retail investors at all is not ideal. Over the long run, retail investors supply trading volume, market breadth and the narrative. With institutions alone, a rally is more likely to "spike and stall" than to "extend." In other words, institutions can build a bottom, but trends often broaden once the public joins in.
- What are institutions after, and why do they "buy" in a falling market?
Institutions are generally not making "short-term moonshot bets." Their goals tend to be three. First, portfolio diversification. Second, managing client assets through products (such as ETFs) that let them hold Bitcoin in a form that meets regulatory and compliance rules. Third, a long-term asset allocation strategy that rebalances weightings during certain stretches (sharp drops, panic). So institutions move less like "chasing headlines" and more like "rule-based rebalancing."
There is a catch. The more channels institutions use to come in, the more mature the market becomes, but the bigger the "day everyone leaves through the same door" gets too. When ETFs post daily net outflows in the $400 million range or even the $1 billion range, short-term volatility can actually increase.
- Is it a problem for coin prices if only institutions hold them?
In the short term it may not be a problem, and it can even help. A larger institutional share can dampen volatility at times, and spot absorption channels can speed up recovery after a crash. Over the long term, though, there are three risks. First, thinner volume and a narrower investor base reduce price elasticity. Second, when institutions go risk-off and outflows all move in one direction, declines can deepen. Third, prices may become more sensitive to "institutional events." In short, a growing institutional share is a sign of maturity but also means "the exit gets bigger."
- BITPRESS Insight: A more profitable question than "retail vs. institutions"
In a falling market, the question that really matters is not "do retail investors need to buy for prices to rise?" but "has the cumulative flow through institutional channels turned?" Looking at just these three numbers will speed up your judgment.
First, look at ETF flows cumulatively over two to three weeks, not day by day. A single day of inflows is a show; cumulative inflows are a trend.
Second, check whether whale cohorts keep accumulating in fear zones, such as the $80,000 range. While big money is buying, the odds of a bottom forming go up.
Third, after a correction of 30% or more from the peak, distinguish between "further collapse" and "sideways trading." Sideways trading is a change of hands, and a change of hands is the stretch where the next direction gets decided.
The conclusion is simple. Without retail, a "rise" is possible but a "bull market" is hard. Institutions don't pump the market to sell; they quietly adjust their weighting "when the conditions to hold it as an asset are met." And the feeling retail investors have at that point is usually just one: "It only goes up after I sell."
Glossary
Spot ETF
Note: A listed product that holds Bitcoin directly (or through an equivalent structure) and can be bought and sold on an exchange like a stock.
Net inflow/net outflow
Note: Money that came in during a period minus money that went out. A positive figure is a net inflow; a negative figure is a net outflow.
Sources
- https://www.barrons.com/articles/bitcoin-xrp-prices-crypto-rebound-jobs-trump-434a0257
- https://farside.co.uk/btc/
- https://www.investors.com/news/bitcoin-morgan-stanley-etf-goldman-crypto-picks-2026-coinbase/
- https://www.coindesk.com/markets/2025/12/29/bitcoin-whales-have-been-the-main-accumulators-in-the-usd80-000-range
- https://coinshares.com/mt-en/insights/research-data/fund-flows-05-01-26/
- https://www.coindesk.com/markets/2026/01/09/bitcoin-etf-optimism-fades-as-three-day-outflows-streak-erases-early-month-gains