
Bitcoin hit a record high above $126,000 on Oct. 6, 2025. Exactly one year later, on Oct. 6, 2026, it was at $85,453, 32% below that peak.
The common reading is that "a crypto bear market has arrived." That's not wrong. But the key lies elsewhere. Compared with a year after each of the past three peaks, this decline is less than half as deep, and experts trace the difference to a change in who owns the market.
- How far did bitcoin fall a year after past peaks?
A year after its 2013 peak, bitcoin was down 69.7%. A year after the December 2017 peak, it was down 82.3%, and a year after the November 2021 peak, 74.6%. This time it is down 32%.
The bottom was shallower, too. This cycle's lowest price, on June 30, 2026, was just under $59,000, a bit more than 53% below the peak. Past bear markets fell 77% to 85% from their highs.
Put simply, if you had bought $10,000 worth at the peak, in the past you would have had roughly $1,800 to $3,000 left a year later; this time you would have about $6,800 (hypothetical calculation). Measured at the June 30 bottom, it would have been about $4,700.
- Why were past bear markets so deep?
Past rallies were driven by individuals trading with borrowed money. When coins bought on borrowed money fall below a set level, the exchange sells them automatically (a forced liquidation). That selling pushes the price lower, which triggers other people's forced liquidations in turn. These cycles often ended with funds and exchanges going bust, as in 2022.
It's like a lender repossessing a car bought on a loan once its value drops, then selling it cheap. The difference is that crypto exchanges do this within minutes, to huge numbers of people at once.
This time, that debt was cleared out in one go right after the peak. On Oct. 10, 2025, more than $19 billion in forced liquidations hit the crypto derivatives market, where traders use borrowed money to bet on whether coin prices will rise or fall. Griffin Ardern, co-founder of the investment firm Primal Fund, said the borrowing was wiped out at the top and never properly came back: "Hence nine months to grind out a 53% decline, rather than a few months of cascading liquidations taking it down 80%."
- Who owned this bull market?
The 2023-25 rally was driven by institutional money flowing in through regulated products such as exchange-traded funds (ETFs, funds bought and sold on an exchange like a stock). US spot ETFs, which hold actual bitcoin, began trading in January 2024. Tim Sun, a senior researcher at crypto financial firm HashKey Group, said buyers this cycle increasingly came from outside the crypto market: ETFs, giant asset managers, family offices (firms that manage a wealthy family's money) and even corporations.
This money moves differently. "ETF allocation money rebalances to target weights — it buys weakness by construction," Ardern explained. Picture someone who has decided to keep 90% of their savings in stocks and 10% in bitcoin. If bitcoin falls and its share drops to 7%, they sell a little stock and buy bitcoin to get back to 10% (hypothetical example).
That doesn't mean institutional money never left. Since the peak, cumulative net inflows into US spot bitcoin ETFs have fallen 5.8%, from about $61.3 billion to $57.7 billion (as of Oct. 5, 2026). Sun said this decline came from money flowing out as the economic backdrop changed, but that the endless vicious circle of past cycles did not happen.
- How much have the price swings shrunk?
According to Sun, bitcoin's annualized volatility (a number measuring how widely the price swings up and down over a year) is now around 40%, about half its long-run historical level of more than 80%.
It's like a car moving from a dirt road onto a paved one. But a smoother road may also make it harder to reach the old top speeds. "As bitcoin evolves and more participants come to market, the realized volatility of the asset will decrease. This means shallower drawdowns and lower highs," said Jeff Anderson of STS Digital, a market maker (a firm that always stands ready to buy and sell).
- How will a market that falls less behave from here?
Ardern compared today's market to the Nasdaq of 1994 to 1999. Back then, too, every interim correction was shallow, yet after peaking in March 2000 the Nasdaq lost nearly 78% over the next two years or so.
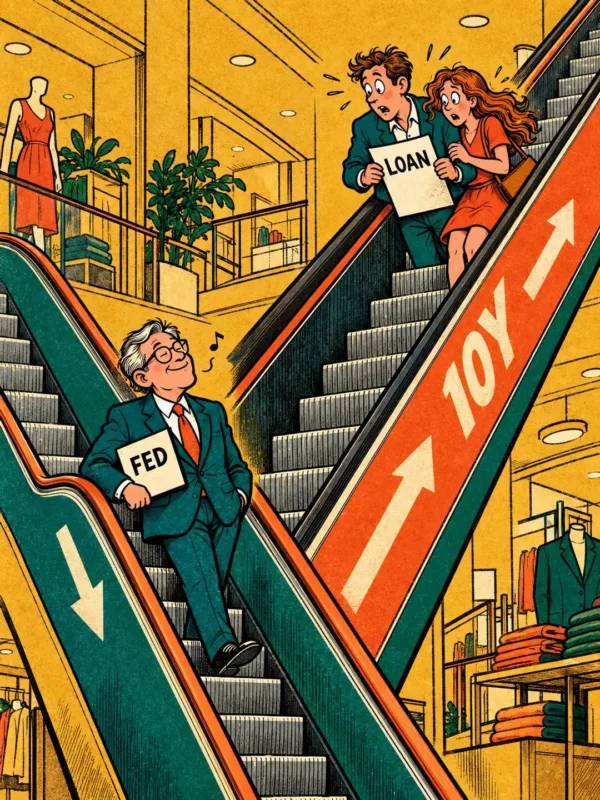
The variable Ardern points to is not debt but interest rates. He said the depth of the next decline will be decided not by bitcoin's chart but by the US 30-year Treasury yield (the interest rate on money the US government borrows for 30 years), which recently hit 5.7%, its highest since April 2002. Just as high deposit rates make it costly to keep cash that earns nothing in a safe, rising rates raise the cost of holding assets that pay no interest, like bitcoin and gold. On the other hand, Sun said that because bitcoin's supply is capped at 21 million coins, a big rush of ETF money in a short time could still send it sharply higher.
- BITPRESS Insight
Look only at the past three cycles and you get this rule of thumb: wait until bitcoin is down about 80% from its peak, then buy. Had you waited for -80% under that rule, you would not have bought at the -53% bottom on June 30 (hypothetical). From just under $59,000 at that bottom, the price rose more than 40% to $85,453 on Oct. 6 (our calculation).
When ownership of the market shifts from individuals using borrowed money to ETF and institutional money that keeps a set mix, the bottoms may get shallower and the rallies may not be what they used to be. It took 28 to 38 months to top each of the past three peaks, and all bitcoin combined was worth around $1.73 trillion as of Oct. 5, so moving its price takes far more money than before.
So the yardstick is not the old cycle chart but who holds bitcoin now. A market full of borrowers tends to fall hard, while a market with lots of ETF money keeping a set mix has buyers ready when prices drop. The first question is which kind of market produced the "target price" you are waiting for.
Sources
https://www.coindesk.com/markets/2026/10/06/from-retail-leverage-to-etf-flows-a-year-after-its-record-high-bitcoin-is-down-just-32
https://cointelegraph.com/markets/bitcoin-etf-90-million-outflow-btc-32-below-record-oct-6
https://247wallst.com/investing/cryptocurrency/2026/10/05/bitcoin-peaked-at-126080-on-october-6-last-year-how-long-does-it-take-to-surpass-a-peak/
Glossary
Forced liquidation — When the price of a coin bought with borrowed money falls below a set level, the exchange automatically sells it to protect the money it lent.
Spot ETF — A fund that actually buys and holds bitcoin and lets people trade shares of it on an exchange like a stock.
Volatility — A number measuring how widely a price swings up and down over a period; the bigger it is, the rougher the ride.
Rebalancing — When price changes knock a planned mix of assets off target, selling what rose and buying what fell to get back to the original mix.
Cumulative net inflows — Money that came into a fund minus money that left, added up from the start.
BITPRESS articles are information to help your investment decisions, not a recommendation to buy or sell any stock or coin. Investment decisions and their results are your own responsibility.